Performance可以给我们提供非常多的信息,但Performance不够直观,需要开发者透过表面的这些参数去分析背后的性能问题。有了这个诉求之后,另一个性能优化工具就出现了,它就是LightHouse。
简介
LightHouse 是 Google 开源的一个自动化工具,用于改进网络应用的质量。你可以将其作为一个 Chrome 扩展程序运行,或从命令行运行。 当为 Lighthouse 提供一个要审查的网址,它将针对此页面运行一连串的测试,然后生成一个有关页面性能的报告。可以参考失败的测试,看看可以采取哪些措施来改进应用。
三种使用方式
可以到谷歌应用商店安装LightHouse,点击添加至Chrome即可。
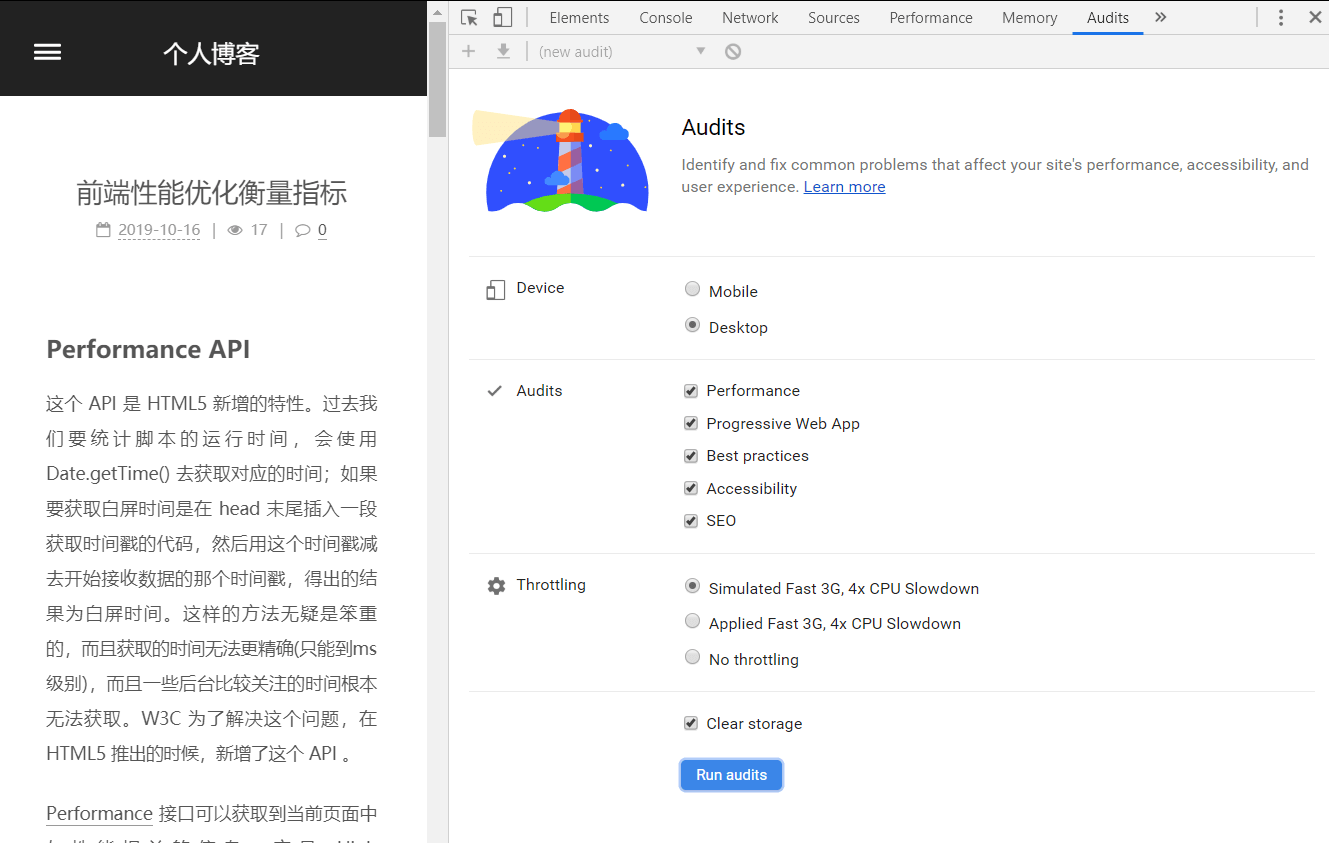
如果浏览器版本较新的话,可以直接打开 Chrome 开发者工具 (F12),然后打开 Audits 面板即可。Audits面板集成了 LightHouse 功能,我们可以根据自己的需要,选择对应的限制条件,运行 Run audits,如下图:

作为命令行工具运行,命令行工具允许您将 Lighthouse 集成到持续集成系统。
1 | // 全局安装 lighthouse |
自动化部分
可以利用 TravisCI 来自动分析修改后的代码的页面性能。
你只需要在 .travis.yml 里面加入以下代码:
1 | language: node_js |
更多详情: ebidel/lighthouse-ci
案例分析
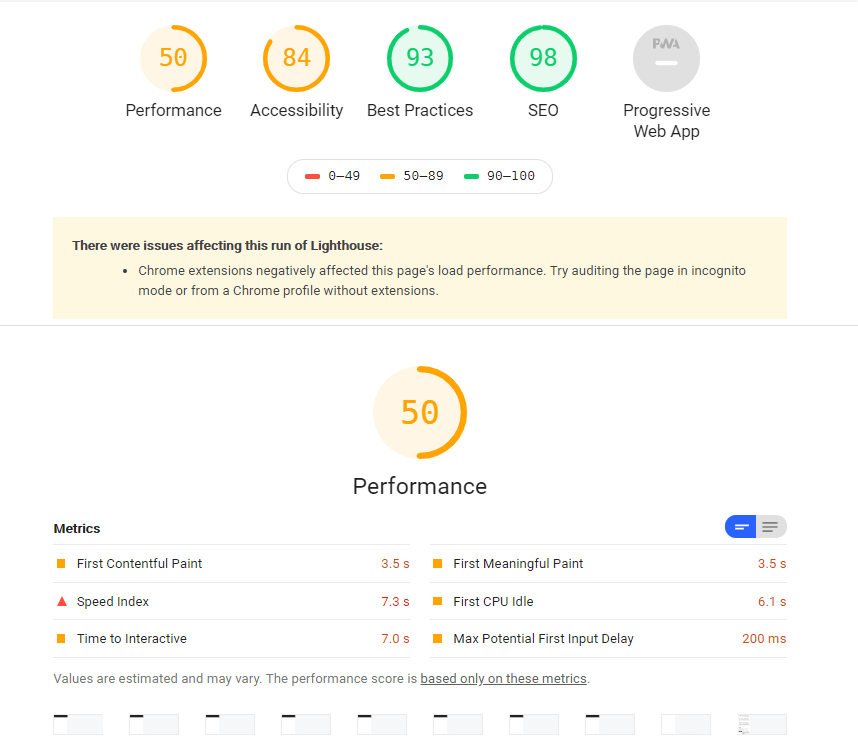
以本站为例,使用 chrome lighthouse生成性能优化测试的报告,直接点击Generate report,然后LightHouse就会自动帮我们生成性能优化报告,如下图:

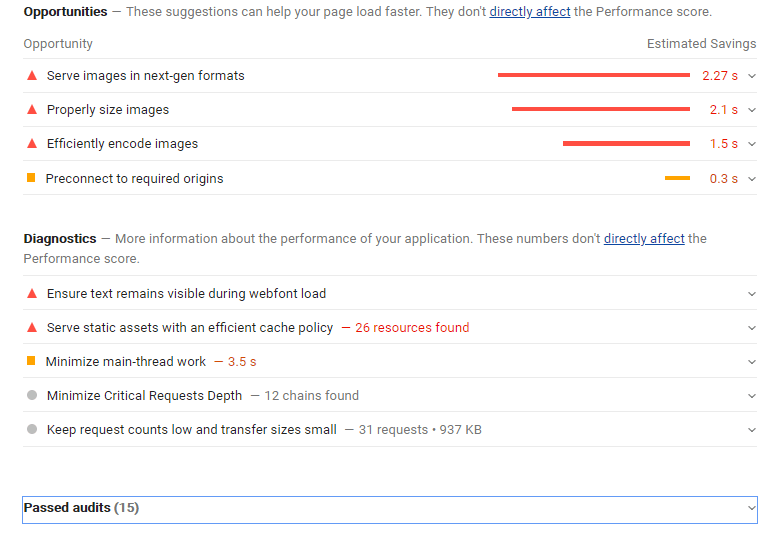
性能优化测试的报告主要包括,Performance(页面性能)、Accessibility(可访性)、Best Practise(最佳实践)、SEO(搜索引擎优化)、Progressive Web App(渐进式应用)。我们点击其中的每一项都可以看到给出的具体优化建议,这里我们以Performance为例,如下图:

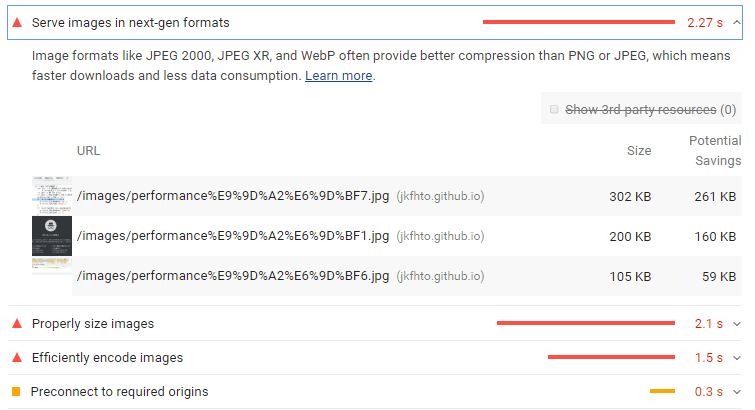
以第一项为例,点击展开可看到更加详细的信息,如下图:

这里推荐我们使用下一代图片格式化的技术,原因是JPEG 2000、JPEG XR和WebP等图像格式通常比PNG或JPEG提供更好的压缩,这意味着更快的下载速度和更少的数据消耗。下面还展示了需要替换的图片资源。点击 Learn more,可以跳转到指定的帮助文档。
相关的性能优化工具
- Exthouse - Analyze the impact of a browser extension on web performance.
- Garie - An open source tool for monitoring performance using Lighthouse, PageSpeed Insights, Prometheus, Grafana and Docker.
- Gimbal - An open source (MIT licensed) tool used to measure, analyze, and budget aspects of a web application. Gimbal also integrates reports with GitHub pull requests.
- Gradle Lighthouse Plugin - An open source Gradle plugin that runs Lighthouse tests on multiple URLs and asserts category score thresholds (useful in continuous integration).
- lightcrawler - Crawl a website and run each page found through Lighthouse.
- lighthouse-badges - Generate gh-badges (shields.io) based on Lighthouse performance.
- lighthouse-batch - Run Lighthouse over a number of sites and generate a summary of their metrics/scores.
- lighthouse-check-action - A Github Action to run Lighthouse in a workflow, featuring Slack notifications and report upload to S3.
- lighthouse-check-orb - A CircleCI Orb to run Lighthouse in a workflow, featuring Slack notifications and report upload to S3.
- lighthouse-ci - Run Lighthouse and assert scores satisfy your custom thresholds.
- lighthouse-ci-action - A Github Action that makes it easy to run Lighthouse in CI and keep your pages small using performance budgets.
- lighthouse-cron - Cron multiple batch Lighthouse audits and emit results for sending to remote server.
- lighthouse-gh-reporter - Run Lighthouse in CI and report back in a comment on your pull requests
- lighthouse-hue - Set the color of Philips Hue lights based on a Lighthouse score
- lighthouse-jest-example - Gather performance metrics via Lighthouse and assert results with Jest; uses Puppeteer to start Chrome with network emulation settings defined by WebPageTest.
- lighthouse-lambda - Run Lighthouse on AWS Lambda with prebuilt stable desktop Headless Chrome.
- lighthouse-magic-light - Set the color of the MagicLight Bluetooth Smart Light Bulb based on Lighthouse score
- lighthouse-mocha-example - Run Lighthouse performance tests with Mocha and chrome-launcher.
- lighthouse-monitor - Run Lighthouse against all your URLs. Send metrics to any backend you want, save all reports with automatic data retention, and compare any two results in a web UI.
- lighthouse-persist - Run Lighthouse and upload HTML reports to an AWS S3 bucket.
- lighthouse4u - LH4U provides Google Lighthouse as a service, surfaced by both a friendly UI+API, and backed by Elastic Search for easy querying and visualization.
- performance-budgets - Easily assert Lighthouse budgets with Docker.
- pwmetrics - Gather performance metrics
- react-lighthouse-viewer - Render a Lighthouse JSON report in a React Component.
- webpack-lighthouse-plugin - Run Lighthouse from a Webpack build.